Visualize Stock Price Time Series
In this blog, we will show how to import the stock price time series from Yahoo Finance and visualize using Pandas. To import data from Yahoo Finance, you need the yfinance and pandas datareader libraries.
from pandas_datareader import data as pdr
import yfinance as yf
import datetime as dt
yf.pdr_override()
Next we import the DBS, UOB and OCBC stock data
tickers = ['U11.SI', 'O39.SI', 'D05.SI']
start = dt.datetime(2005, 1, 1)
end = dt.datetime(2021, 9, 30)
mydata = pd.DataFrame()
for ticker in tickers:
mydata[ticker] = pdr.get_data_yahoo(ticker, start, end)['Adj Close']
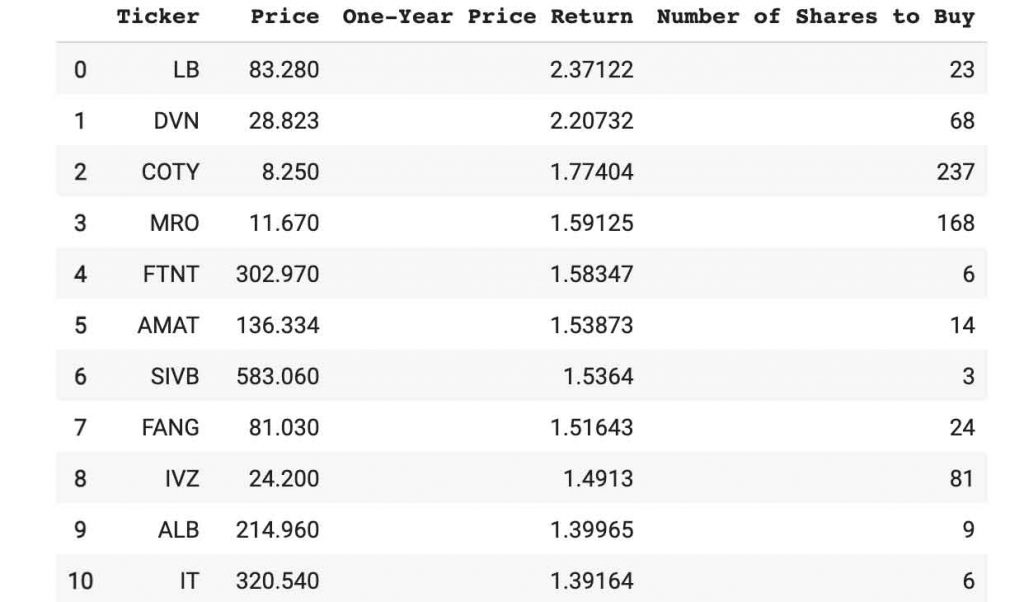
print(data)The result is shown below
Next we can visualize the stock time series data nelow
mydata.plot(figsize=(10,6))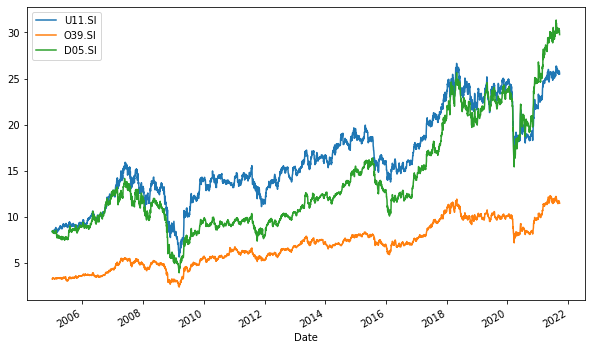
References:
Relevant Courses
September 21, 2021