Stock Price Forecasting using LSTM
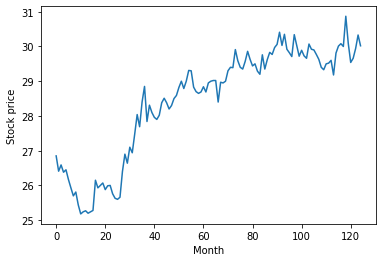
LSTM has been very useful to predict time series data. We have previously discussed about the time series forecasting using Pytorch Deep Learning framework in this time series forecasting blog. In this article, we will demonstrate how to apply the LSTM to predict stock price. We will get our 6 months DBS stock price from Yahoo Finance.
The LSTM model for the stock price is shown below
class LSTM(nn.Module):

    def __init__(self, num_classes, input_size, hidden_size, num_layers):
        super(LSTM, self).__init__()

        self.num_classes = num_classes
        self.num_layers = num_layers
        self.input_size = input_size
        self.hidden_size = hidden_size
        self.seq_length = seq_length

        self.lstm = nn.LSTM(input_size=input_size, hidden_size=hidden_size,
                            num_layers=num_layers, batch_first=True)

        self.fc = nn.Linear(hidden_size, num_classes)

    def forward(self, x):
        h_0 = torch.zeros(self.num_layers, x.size(0), self.hidden_size)
        c_0 = torch.zeros(self.num_layers, x.size(0), self.hidden_size)

        # Propagate input through LSTM
        _, (h_out, _) = self.lstm(x, (h_0, c_0))
        h_out = h_out.view(-1, self.hidden_size)
        out = self.fc(h_out)

        return out
To form the data, we can define a sliding window to scan the training data
def sliding_window(data, seq_length):
    x = []
    y = []

    for i in range(len(data)-seq_length-1):
        _x = data[i:(i+seq_length)]
        _y = data[i+seq_length]
        x.append(_x)
        y.append(_y)

    return np.array(x),np.array(y)
To test the model, we can split the time series data into training and. testing set
train_size = int(len(y) * 0.67)
test_size = int(len(y)) - train_size

dataX = torch.Tensor(np.array(x))
dataY = torch.Tensor(np.array(y))

trainX = torch.Tensor(np.array(x[0:train_size]))
trainY = torch.Tensor(np.array(y[0:train_size]))

testX = torch.Tensor(np.array(x[train_size:len(x)]))
testY = torch.Tensor(np.array(y[train_size:len(y)]))
We can plot the actual and predicted stock prices using scikit learn and matplotlib libraries
train_predict = lstm(dataX)

data_predict = train_predict.data.numpy()
dataY_plot = dataY.data.numpy()

data_predict = sc.inverse_transform(data_predict)
dataY_plot = sc.inverse_transform(dataY_plot)

plt.axvline(x=train_size, c='g', linestyle='--')

plt.plot(dataY_plot,'b',label='actual')
plt.plot(data_predict,'r',label='prediction')
plt.suptitle('Time Series Prediction for DBS stock price is the last 6 months')
plt.xlabel('Month')
plt.ylabel('Stock Price')
plt.legend()
plt.show()
LSTM
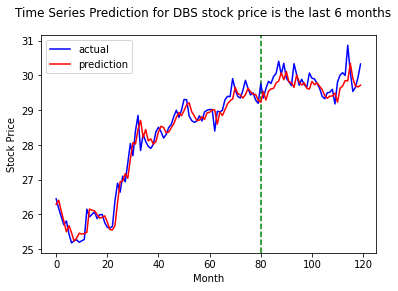
The result shows that LSTM model is extremely good in predicting the stock price.
References:
Relevant Courses
July 18, 2021